Quantitative Factors
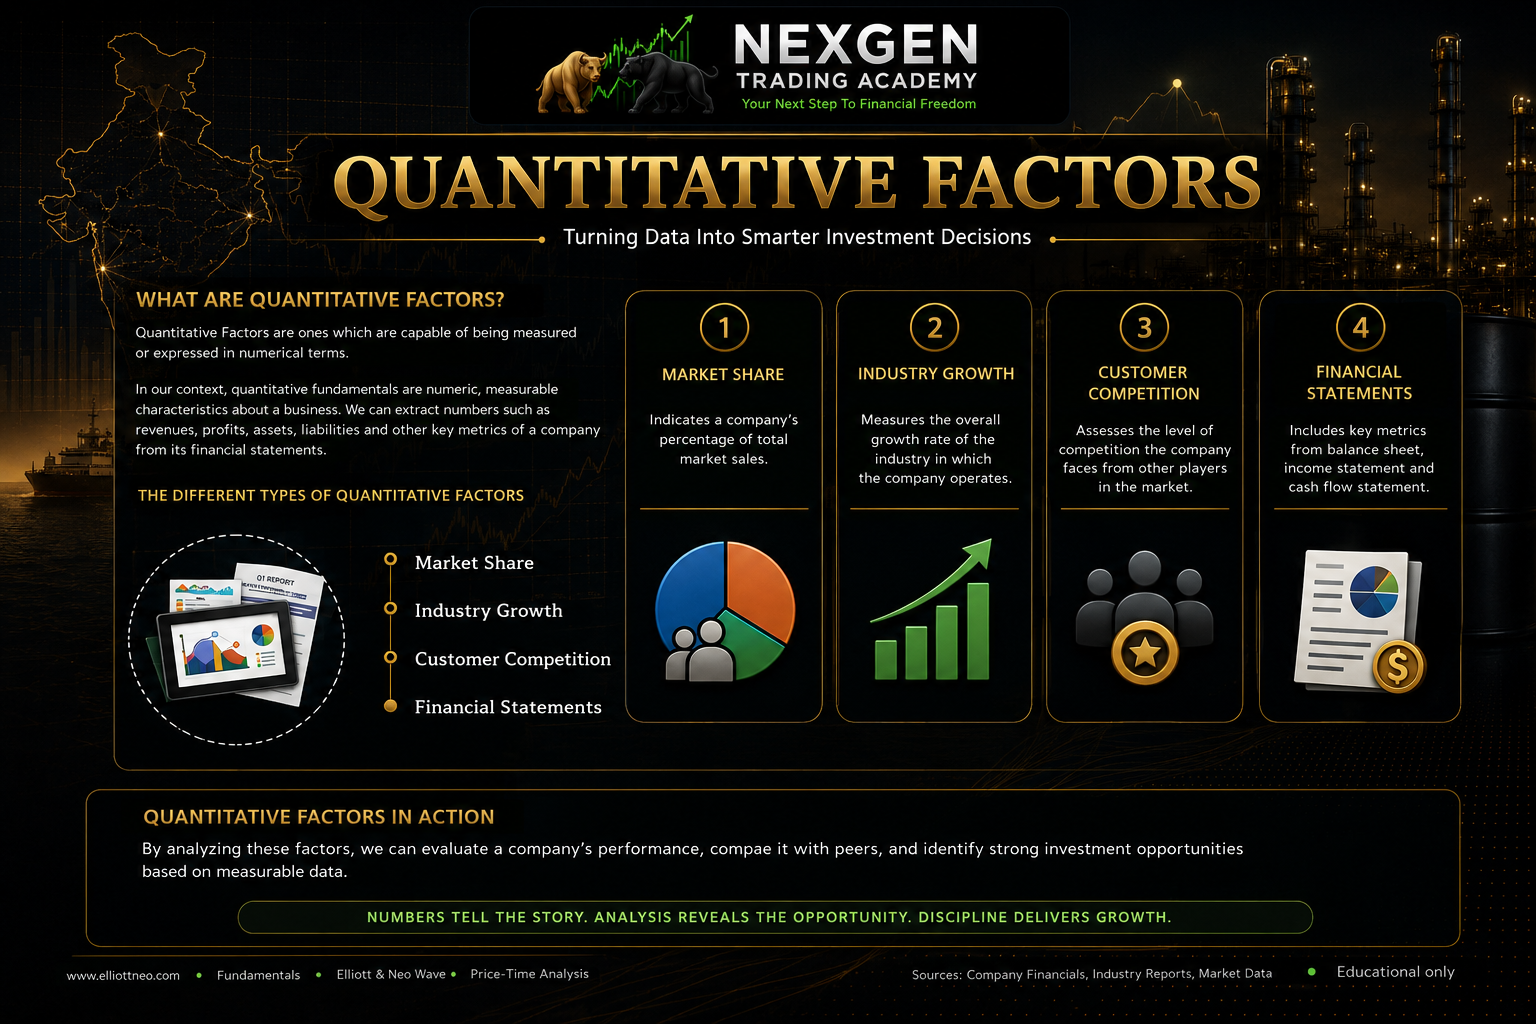
While qualitative analysis helps investors understand the non-financial aspects of a business, successful investing also requires the ability to evaluate measurable financial information. A company may possess an excellent management team, a well-known brand, and a strong business model, but if its financial performance remains weak or inconsistent, it may struggle to create long-term shareholder value. This is where quantitative factors become essential. Quantitative analysis focuses on numerical data that enables investors to evaluate a company's profitability, financial stability, operational efficiency, and overall financial health using objective measurements.Quantitative factors are measurable financial indicators that help investors assess the performance and valuation of a business. These factors are obtained primarily from the company's financial statements and include information such as revenue, profit, earnings per share, return on equity, debt levels, operating margins, cash flow, and various financial ratios. Unlike qualitative factors, which involve subjective judgment, quantitative factors provide objective numerical evidence that can be compared across companies, industries, and financial periods.The primary objective of quantitative analysis is to determine whether a company is generating sustainable financial performance. Investors examine historical financial data to identify patterns of growth, profitability, efficiency, and financial discipline. Consistent improvement in these indicators often reflects a well-managed business capable of creating long-term shareholder value.One of the most important quantitative factors is Revenue, also known as Sales or Turnover. Revenue represents the total income generated by a company from its primary business operations before deducting any expenses. It reflects the company's ability to sell its products or services in the marketplace. While increasing revenue generally indicates business expansion, investors should also determine whether revenue growth is accompanied by improving profitability. Rapid sales growth without corresponding profit growth may indicate rising costs or declining operational efficiency.Closely related to revenue is Net Profit, which represents the amount remaining after deducting all operating expenses, interest, taxes, depreciation, and other costs from total revenue. Net profit reflects the company's overall profitability and its ability to convert sales into earnings for shareholders. Businesses demonstrating consistent growth in net profit over several years generally possess stronger financial foundations than companies experiencing volatile or declining profitability.Another widely used quantitative measure is Earnings Per Share (EPS). EPS is calculated by dividing the company's net profit available to equity shareholders by the total number of outstanding equity shares. It indicates the amount of profit attributable to each share owned by investors. Higher and consistently growing EPS often reflects improving profitability and efficient business management. However, investors should also consider corporate actions such as bonus issues, stock splits, or buybacks that may influence EPS calculations without changing the company's actual earnings.The Price-to-Earnings (P/E) Ratio is another important valuation measure used extensively in fundamental analysis. The P/E Ratio compares the current market price of a share with its Earnings Per Share. It helps investors determine how much the market is willing to pay for each unit of the company's earnings. A higher P/E Ratio may indicate strong future growth expectations, while a lower P/E Ratio may suggest either undervaluation or weaker future prospects. Since valuation levels vary across industries, investors should compare P/E Ratios primarily among companies operating within the same sector.Return on Equity (ROE) is one of the most important profitability ratios used by long-term investors. ROE measures how efficiently a company generates profits from the shareholders' invested capital. It is calculated by dividing net profit by shareholders' equity. Companies consistently maintaining high Return on Equity generally demonstrate efficient management, prudent capital allocation, and strong operational performance. However, investors should also evaluate whether exceptionally high ROE results from genuine profitability or excessive financial leverage.Another useful indicator is Return on Assets (ROA). ROA measures how effectively a company utilizes its total assets to generate profits. It is calculated by dividing net profit by total assets. Businesses capable of producing higher earnings from relatively smaller asset bases generally demonstrate greater operational efficiency. Asset-intensive industries such as manufacturing may naturally report lower ROA than service-oriented businesses, making industry comparison important.Return on Capital Employed (ROCE) is another valuable measure of business performance. ROCE evaluates how efficiently a company utilizes both shareholders' equity and borrowed funds to generate operating profits. Investors often use ROCE to compare companies with different capital structures because it provides a broader assessment of capital utilization than Return on Equity alone.The company's Debt-to-Equity Ratio measures financial leverage by comparing total debt with shareholders' equity. Businesses relying excessively on borrowed funds may experience greater financial risk because they must continue servicing debt regardless of business conditions. While moderate debt can support business expansion, excessively high leverage increases vulnerability during economic downturns. Investors generally prefer companies maintaining a balanced capital structure with manageable debt levels.Liquidity is another important aspect of quantitative analysis. The Current Ratio measures a company's ability to meet its short-term financial obligations using its current assets. It is calculated by dividing current assets by current liabilities. A healthy Current Ratio indicates that the company possesses sufficient liquid resources to finance day-to-day operations and satisfy short-term liabilities without financial stress.Another widely used liquidity measure is the Quick Ratio, sometimes referred to as the Acid-Test Ratio. Unlike the Current Ratio, the Quick Ratio excludes inventory from current assets because inventory may not always be converted into cash quickly. This ratio provides a more conservative assessment of the company's short-term financial strength.Operating Margin measures the proportion of revenue remaining after deducting operating expenses but before interest and taxes. Higher operating margins generally indicate greater operational efficiency and stronger pricing power. Investors often compare operating margins across companies within the same industry to identify businesses capable of maintaining superior profitability.The Net Profit Margin represents the percentage of revenue retained as net profit after all expenses have been deducted. Companies consistently maintaining healthy profit margins often possess competitive advantages such as strong brand recognition, efficient operations, or pricing power. Declining profit margins may indicate increasing competition, rising production costs, or weakening operational efficiency.Cash generation is another critical area of quantitative analysis. The Cash Flow from Operating Activities reflects the actual cash generated by the company's core business operations. Unlike accounting profits, which may include non-cash adjustments, operating cash flow demonstrates whether the business generates sufficient cash to support its daily activities, repay debt, invest in expansion, and reward shareholders. Strong operating cash flow generally indicates a financially healthy business.Investors should also examine the company's Free Cash Flow, which represents the cash remaining after funding necessary capital expenditures. Free cash flow provides management with flexibility to repay debt, distribute dividends, repurchase shares, pursue acquisitions, or invest in future growth opportunities. Companies consistently generating positive free cash flow are often better positioned for long-term financial stability.Another important quantitative factor is the Dividend Yield, particularly for investors seeking regular income. Dividend Yield measures the annual dividend received relative to the current market price of the share. While higher dividend yields may appear attractive, investors should evaluate whether the dividend is supported by sustainable earnings and cash flow rather than temporary financial circumstances.Although quantitative analysis provides valuable financial information, investors should avoid evaluating individual ratios in isolation. A company may report strong profitability while carrying excessive debt, or it may possess excellent liquidity but weak earnings growth. Financial indicators should therefore be analysed collectively to obtain a balanced understanding of the company's overall financial condition.It is equally important to compare quantitative measures over multiple financial years rather than relying on a single reporting period. Temporary events, economic conditions, or one-time transactions may distort annual results. Long-term trends provide a more reliable indication of business quality, management effectiveness, and financial consistency.Industry comparison also plays a vital role in quantitative analysis. Financial ratios vary considerably across sectors because different industries operate under different business models, capital requirements, and profit structures. Comparing a technology company with a manufacturing business using identical benchmarks may produce misleading conclusions. Investors should therefore evaluate companies relative to their industry peers.Successful investors combine quantitative analysis with qualitative assessment to form a comprehensive view of the business. Strong financial performance supported by capable management, competitive advantages, sound corporate governance, and sustainable business models often identifies companies capable of generating long-term shareholder value. Neither qualitative nor quantitative analysis alone provides a complete picture; together, they form the foundation of effective fundamental analysis.In conclusion, Quantitative Factors provide objective financial measurements that enable investors to evaluate a company's profitability, liquidity, operational efficiency, capital structure, and overall financial health. Revenue, net profit, earnings per share, return on equity, debt levels, cash flow, and other financial ratios help investors assess business performance using measurable evidence rather than speculation. By carefully analysing these quantitative factors alongside qualitative characteristics, investors can make informed decisions based on comprehensive business evaluation and build a disciplined approach to long-term stock investing.
Mastering quantitative factors builds lasting financial clarity, confidence, and disciplined execution.
Core Concepts & Foundational Principles
Summary & Key Takeaways
Mastering quantitative factors is vital for developing sound financial and investment discipline..
Core Principle: Quantitative Factors
Key Mechanics & Frameworks
Consistent long-term habits create significantly greater wealth than short-term speculative decisions..
Continuous study and structured application of Stock Investing Basics for Beginners A Practical Guide to Fundamental Analysis, Financial Statements, and Long-Term Wealth Creation empowers smart decision-making..
Summary & Key Takeaways
- Consistent long-term habits create significantly greater wealth than short-term speculative decisions.
- Mastering quantitative factors is vital for developing sound financial and investment discipline.
- Summary & Key Takeaways.